Gnuplot Practice
Lets look at some gnuplot examples.
Code
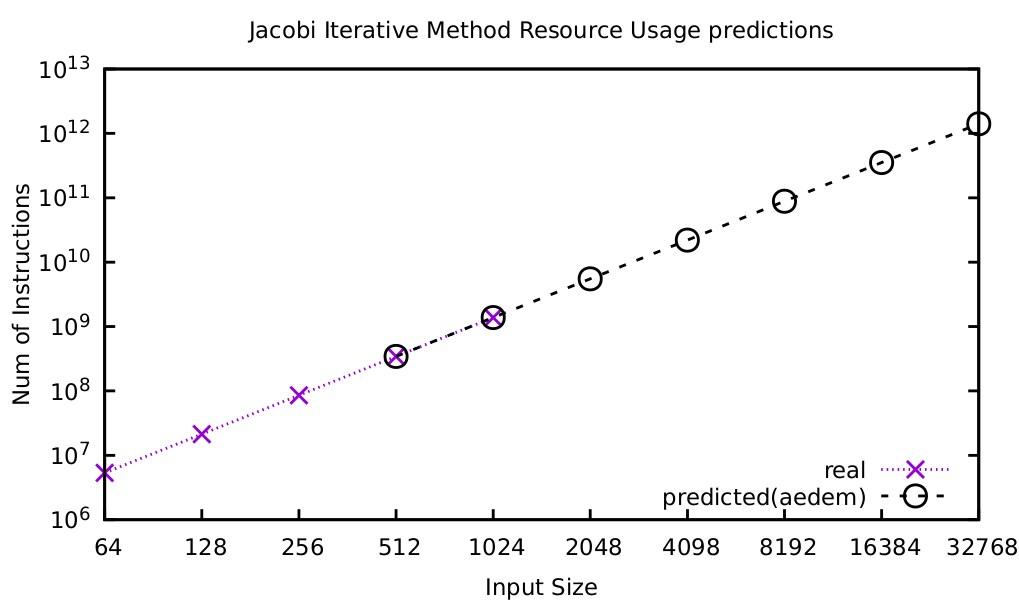
set terminal pdf enhanced linewidth 2
set output "jacobi-real-vs-aedem-resource-usage.pdf"

#set logscale y
#set logscale x
set log xy           #set logscale at the same time
set yrange [*:*]
set xrange [*:*]     # to get a smart range

#set ytics nomirror  # to disable mirroring on second y axis
unset mytics         # disable minor yticsa

set xtics (64,128,256,512,1024,2048,4098,8192,16384,32768) nomirror #xtics at scecific numbers

set key bottom right
set title "Jacobi Iterative Method Resource Usage predictions"
set ylabel "Total Usage"
set xlabel "Input Size"

set ylabel "Num of Instructions"
plot "jacobi-original.dat" using 1:2 with linespoints pt 2 dt '.' title "real",\
 "jacobi-predictions.dat" using 1:2 with linespoints pt 6 ps 1.3 dt 2 lc rgb "black" title "predicted(aedem)"
Sample-2 : Gnuplot Stacked
This is a difficult one to pull off and took me couple of hours on an important day. Lets take a look.
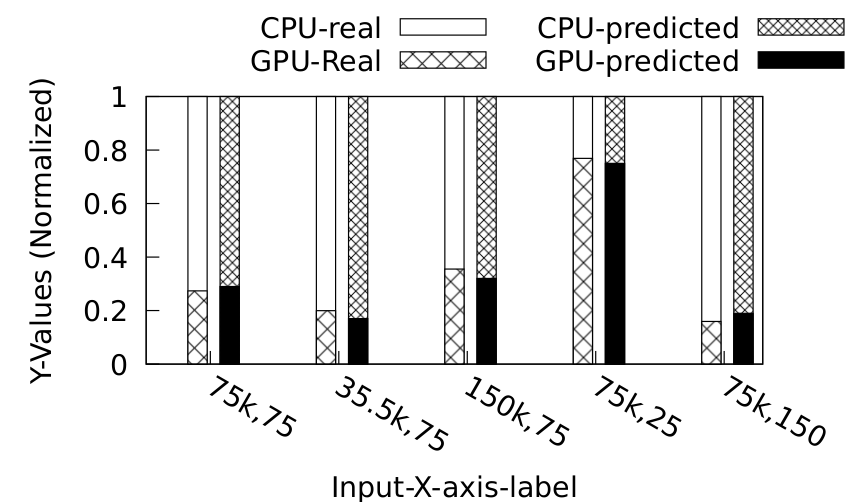
set term pdfcairo enhanced mono font ",18"
set output 'CPU-GPU-stacked.pdf'
set datafile separator ","

set ylabel "Y-Values (Normalized)" offset 1,0
set xlabel "Input-X-axis-label"

set auto x
set yrange [0:1]
set xtics 1

set boxwidth 0.9
set style fill pattern border lt 1

set key horiz
set key out left top

num_of_categories=2
set boxwidth 0.3/num_of_categories
dx=0.5/num_of_categories
offset=-0.1
set xtics rotate by -30

#renaming the X-axis labels
set xtics ("75k,75" 1, "35.5k,75" 2, "150k,75" 3, "75k,25" 4, "75k,150" 5)
set xrange [0.5:*]

set xtics nomirror
set ytics nomirror

set style increment default

plot 'input1.dat' using ($1+offset):($3+$4) title "CPU-real" lt 1 lc rgb "black" with boxes, \
     ''                   using ($1+offset):3 title "GPU-Real" lt 1 lc  rgb "black" with boxes, \
     'input2.dat' using ($1+offset+dx):($3+$4) title "CPU-predicted" lt 1 lc rgb "black" with boxes, \
     ''                   using ($1+offset+dx):3 title "GPU-predicted" lt 1 lc rgb "black" with boxes
Required Files (input1.dat, input2.dat)
#vim input1.dat
#x-axis-labels, Keyword, actual-value-1, actual-value-2
1,Actual,0.273865,0.726135
2,Actual,0.199708,0.800352
3,Actual,0.355382,0.644618
4,Actual,0.768791,0.231151
5,Actual,0.159583,0.840417
#vim input2.dat
#x-axis-labels, Keyword, predicted-val-1, predicted-val-2
1,Predicted,0.29,0.71
2,Predicted,0.17,0.83
3,Predicted,0.32,0.68
4,Predicted,0.75,0.25
5,Predicted,0.19,0.81Plotting
- dt dashtype
- dt ‘.’
- dt 2
- pt poittype
- pt 1-25
- ps pointsize
- ps float-size
- lc line-color
- lc rgb “black”